
Not too sure of all the key parameters to watch out for currently but working at learning stuff.....
One thing that looks odd (and I don't know how it works it out ?) is the 'power' - it never seems to go over 100bhp but does show it going down to -50 ?!
So I guess the power band might actually be up to 150 bhp but plotting on the graph might be wrong ?
Can't give an example right now as I'm on my phone.......
| Home | WikiLEC | Repairs | Upgrades | Gallery | Buy & Sell | Mountain Chips | Meets & Events | Contact |
|
First Scan - anybody fancy a gander ?!
Moderators: theelanman, dapinky, Specky, clemo, Nige, Sy V, Dave Eds, DaveT, Elanlover, muley, Enright, algirdas, nitroman, GeoffSmith
46 posts
• Page 3 of 3 • 1, 2, 3
Re: First Scan - anybody fancy a gander ?!
 by simonbuk » Mon 18.11.2024, 11:21
Black S2 No.357
Aqua Blue S2 No.385
Simonthesailor
"Twenty years from now you will be more disappointed by the things that you didn't do than by the ones you did. So buy an Elan" - Mark Twain.
Aqua Blue S2 No.385
Simonthesailor
"Twenty years from now you will be more disappointed by the things that you didn't do than by the ones you did. So buy an Elan" - Mark Twain.
-
simonbuk - God
- Posts: 1600
- Joined: Sun 13.03.2016, 12:50
- Location: Mostly Worthing,West Sussex, sometimes the canals.......
Re: First Scan - anybody fancy a gander ?!
by chrism » Mon 18.11.2024, 11:26
Yep, agree with RonR - the O2 sensor plot gives relief.
I'd be suspicious of power data tho'. I don't know how EScan could measure it other than by a boost/%throttle comparison with an 'expected' max bhp? There is correlation there if you overlay data...
I hadn't been much interested in the past about bhp so I looked up my original 1499 conversion scan trip and got a similarly meaningless graph:-
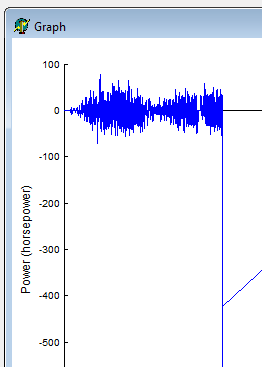
RonR recently found discrepancy (with axes and a sensor voltage conversion factor, I think) in the original and I think you've probably found another. The axes seem meaningless - perhaps the shape is the only credible offering of bhp.
The cynic in me reckons it's a (say) '50% throttle of 160bhp = 80bhp'' or '0.3 out of 0.6 boost = 80bhp' kind of estimate without the sophistication of correct axes...no further accuracy than this...
It'd be interesting to see if anyone's made sense of it to date or given it any relevance?
ps using your axes theory, when you gave it 'beans' you'd have had ~200bhp...nah not partictularly impressed or convinced with this bit of the EScan software, I'm afraid...
I'd be suspicious of power data tho'. I don't know how EScan could measure it other than by a boost/%throttle comparison with an 'expected' max bhp? There is correlation there if you overlay data...
I hadn't been much interested in the past about bhp so I looked up my original 1499 conversion scan trip and got a similarly meaningless graph:-
RonR recently found discrepancy (with axes and a sensor voltage conversion factor, I think) in the original and I think you've probably found another. The axes seem meaningless - perhaps the shape is the only credible offering of bhp.
The cynic in me reckons it's a (say) '50% throttle of 160bhp = 80bhp'' or '0.3 out of 0.6 boost = 80bhp' kind of estimate without the sophistication of correct axes...no further accuracy than this...
It'd be interesting to see if anyone's made sense of it to date or given it any relevance?
ps using your axes theory, when you gave it 'beans' you'd have had ~200bhp...nah not partictularly impressed or convinced with this bit of the EScan software, I'm afraid...
Last edited by chrism on Mon 18.11.2024, 11:42, edited 2 times in total.
-
chrism - God
- Posts: 894
- Joined: Sun 16.01.2022, 14:36
- Location: West Sussex, UK
Re: First Scan - anybody fancy a gander ?!
by simonbuk » Mon 18.11.2024, 11:36
Cheers for looking - I think it might be nonsense so not concerned enough to do anything at the moment.
Thanks for the loan of the O2 sensor and removal tool - I'll drop it off shortly.
Just dropped my car at a friend's garage to check base timing and emissions , and my alternator may have died on the way there
Thanks for the loan of the O2 sensor and removal tool - I'll drop it off shortly.
Just dropped my car at a friend's garage to check base timing and emissions , and my alternator may have died on the way there
Black S2 No.357
Aqua Blue S2 No.385
Simonthesailor
"Twenty years from now you will be more disappointed by the things that you didn't do than by the ones you did. So buy an Elan" - Mark Twain.
Aqua Blue S2 No.385
Simonthesailor
"Twenty years from now you will be more disappointed by the things that you didn't do than by the ones you did. So buy an Elan" - Mark Twain.
-
simonbuk - God
- Posts: 1600
- Joined: Sun 13.03.2016, 12:50
- Location: Mostly Worthing,West Sussex, sometimes the canals.......
Re: First Scan - anybody fancy a gander ?!
by Tuga2112 » Mon 18.11.2024, 12:18
chrism wrote:ps using your axes theory, when you gave it 'beans' you'd have had ~200bhp...nah not partictularly impressed or convinced with this bit of the EScan software, I'm afraid...
my understading is that with an everest chip, bigger bore exhaust and a healthy running car you can get there, or at least pretty close.
but i share your opinion, it must be just a guess caluclation.
Still learning
Youtube Channel @Tuga2112 M100 repair videos
Youtube Channel @Tuga2112 M100 repair videos
-

Tuga2112 - God
- Posts: 3039
- Joined: Fri 12.09.2014, 22:54
- Location: Durham with a regular trip to Walsall
Re: First Scan - anybody fancy a gander ?!
by dapinky » Mon 18.11.2024, 15:16
I'm no expert, and don't know the algorithm, but it has long been said that the power is a 'calculated' value not a 'read' value.......
Dave
Just the one now, but this one's mine! - and it will be finished eventually..... - but also temporary custodian of a project until it is finished enough for Angie to drive it
...oh, and a 2006 Freelander destined for the jungles of The Gambia - 4500 miles across roads, desert and tracks - what could possibly go wrong?
Just the one now, but this one's mine! - and it will be finished eventually..... - but also temporary custodian of a project until it is finished enough for Angie to drive it
...oh, and a 2006 Freelander destined for the jungles of The Gambia - 4500 miles across roads, desert and tracks - what could possibly go wrong?
-

dapinky - LEC Administrator
- Posts: 10606
- Joined: Sun 15.10.2006, 12:54
- Location: As far west as you can get in West Wales before you become Irish (Pembroke Dock).
Re: First Scan - anybody fancy a gander ?!
by RonR » Mon 18.11.2024, 23:59
Looking at the Elanscan 'ini' file, the power figure isn't amongst the ALDL data sent from the ECU, it's an internal Elanscan calculation.
I imagine it's calculated with some or all of: Rate of change of velocity (acceleration), Diff Ratio, Gear used, Gear ratio, RPM, Tyre radius, Weight of car, Transmission losses, etc...
I imagine it's calculated with some or all of: Rate of change of velocity (acceleration), Diff Ratio, Gear used, Gear ratio, RPM, Tyre radius, Weight of car, Transmission losses, etc...
-

RonR - Fanatic
- Posts: 723
- Joined: Mon 22.08.2016, 20:25
- Location: Bromley
46 posts
• Page 3 of 3 • 1, 2, 3
Who is online
Users browsing this forum: No registered users and 7 guests