
Afternoon All
I recently purchased an Elanscan cable from Jaoa to try to establish a rich running at idle problem.
I've scourged through the posts on here - Could someone point me to a Basic (Idiots) Guide to setting up the communication link to my Windows11 laptop?
Much obliged, Alan
| Home | WikiLEC | Repairs | Upgrades | Gallery | Buy & Sell | Mountain Chips | Meets & Events | Contact |
|
Basic guide to using Elanscan
Moderators: theelanman, dapinky, Specky, clemo, Nige, Sy V, Dave Eds, DaveT, Elanlover, muley, Enright, algirdas, nitroman, GeoffSmith
8 posts
• Page 1 of 1
Basic guide to using Elanscan
 by Scotelan » Sat 04.07.2026, 15:38
Half the lies you hear aren't true
-

Scotelan - Newbie
- Posts: 5
- Joined: Wed 18.09.2024, 14:25
Re: Basic guide to using Elanscan
by dapinky » Sat 04.07.2026, 16:37
Hi Alan, and welcome to LEC - there are many threads about using Elanscan - but many are outdated as they were written when Windows XP was evolving to the 'new fangled' W7!....
.... however, this is the 'best' thread to start at, as it is probably the most recent (with what was current information when it was written).
viewtopic.php?f=34&t=30234
.... however, this is the 'best' thread to start at, as it is probably the most recent (with what was current information when it was written).
viewtopic.php?f=34&t=30234
Dave
Just the one now, but this one's mine! - and it will be finished eventually..... - but also temporary custodian of a project until it is finished enough for Angie to drive it
...oh, and a 2006 Freelander destined for the jungles of The Gambia - 4500 miles across roads, desert and tracks - what could possibly go wrong?
Just the one now, but this one's mine! - and it will be finished eventually..... - but also temporary custodian of a project until it is finished enough for Angie to drive it
...oh, and a 2006 Freelander destined for the jungles of The Gambia - 4500 miles across roads, desert and tracks - what could possibly go wrong?
-

dapinky - LEC Administrator
- Posts: 10578
- Joined: Sun 15.10.2006, 12:54
- Location: As far west as you can get in West Wales before you become Irish (Pembroke Dock).
Re: Basic guide to using Elanscan
by Scotelan » Sat 04.07.2026, 17:52
dapinky wrote:Hi Alan, and welcome to LEC - there are many threads about using Elanscan - but many are outdated as they were written when Windows XP was evolving to the 'new fangled' W7!....
.... however, this is the 'best' thread to start at, as it is probably the most recent (with what was current information when it was written).
viewtopic.php?f=34&t=30234
Thanks Dave, I certainly havent used Zip for yonks but it should come back to me but I can't for the life of me understand why I had to download X Box

Half the lies you hear aren't true
-
Scotelan - Newbie
- Posts: 5
- Joined: Wed 18.09.2024, 14:25
Re: Basic guide to using Elanscan
by chrism » Sat 04.07.2026, 20:24
Scotelan here's the 'EScan_beta' link from dapinky's post. This is the very latest version of EScan updated in 2024 by LEC 'gurus' and supercedes all others...
download/file.php?id=29899
Double-click on it and you'll get 'new Escan_beta and settings':-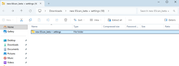
Double-click to open it and you'll get these 4 elements:-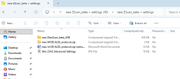
Open and run the two compressed files. I seem to remember that the word doc contains instr to update the old protocol for those who are updating from an older version. The .jpg file has typical settings that, I found, worked for me.
When first running 'EScan_beta' you might have to find your own comm port in 'device manager' and change the EScan comm box...
Hope this helps; I think that's it (but I haven't loaded this new version myself for ages) loadsa luck 
download/file.php?id=29899
Double-click on it and you'll get 'new Escan_beta and settings':-
Double-click to open it and you'll get these 4 elements:-
Open and run the two compressed files. I seem to remember that the word doc contains instr to update the old protocol for those who are updating from an older version. The .jpg file has typical settings that, I found, worked for me.
When first running 'EScan_beta' you might have to find your own comm port in 'device manager' and change the EScan comm box...
Hope this helps; I think that's it (but I haven't loaded this new version myself for ages
) loadsa luck -
chrism - God
- Posts: 846
- Joined: Sun 16.01.2022, 14:36
- Location: West Sussex, UK
Re: Basic guide to using Elanscan
by Scotelan » Thu 30.07.2026, 12:10
chrism wrote:Scotelan here's the 'EScan_beta' link from dapinky's post. This is the very latest version of EScan updated in 2024 by LEC 'gurus' and supercedes all others...
download/file.php?id=29899
Double-click on it and you'll get 'new Escan_beta and settings':-
Double-click to open it and you'll get these 4 elements:-
Open and run the two compressed files. I seem to remember that the word doc contains instr to update the old protocol for those who are updating from an older version. The .jpg file has typical settings that, I found, worked for me.
When first running 'EScan_beta' you might have to find your own comm port in 'device manager' and change the EScan comm box...
Hope this helps; I think that's it (but I haven't loaded this new version myself for ages
Thank you, I've just seen your post. Setting the Comm port sorted it, I just need to sort out the graphing now. There's a surprising amount of information available for a 36 year old system!
#Thanks
Half the lies you hear aren't true
-
Scotelan - Newbie
- Posts: 5
- Joined: Wed 18.09.2024, 14:25
Re: Basic guide to using Elanscan
by chrism » Thu 30.07.2026, 13:46
Scotelan, EScan can start and stop talking as well as start and stop logging.
If you decide to log your data, when you stop logging you'll have the option of saving it. Once you open a saved log the graphs will load up into the window on the rhs of your Escan and you can choose from the parameters what particular aspect you'd like to inspect.
If you decide to log your data, when you stop logging you'll have the option of saving it. Once you open a saved log the graphs will load up into the window on the rhs of your Escan and you can choose from the parameters what particular aspect you'd like to inspect.
-
chrism - God
- Posts: 846
- Joined: Sun 16.01.2022, 14:36
- Location: West Sussex, UK
Re: Basic guide to using Elanscan
by Scotelan » Thu 13.08.2026, 14:29
I have the current version of Elanscan, Comm port correctly set and the latency set to 1.
The left information section is getting populated when the engine is running (but empty with only the ignition on) but I cannot get the graph populated. It might be something simple that I've not "ticked" but it beyond my grey matter. The error log states "No reply/ No frame start byte received". I've clicked the talking and logging buttons but to no avail - any thoughts welcomed, thanks
https://1drv.ms/i/c/8a36c53dff317648/IQDeEfFKQDS8Tbtm9cK2tqKwAZ-tsi5Ez76p0cB_lUQ9fJs?e=fdWFGx
The left information section is getting populated when the engine is running (but empty with only the ignition on) but I cannot get the graph populated. It might be something simple that I've not "ticked" but it beyond my grey matter. The error log states "No reply/ No frame start byte received". I've clicked the talking and logging buttons but to no avail - any thoughts welcomed, thanks
https://1drv.ms/i/c/8a36c53dff317648/IQDeEfFKQDS8Tbtm9cK2tqKwAZ-tsi5Ez76p0cB_lUQ9fJs?e=fdWFGx
Half the lies you hear aren't true
-
Scotelan - Newbie
- Posts: 5
- Joined: Wed 18.09.2024, 14:25
Re: Basic guide to using Elanscan
by KenS » Fri 14.08.2026, 17:32
Hi, a couple of things that may prevent getting full plots:
1/ Talking and Logging need to be stopped in order to view the graphs from that session or from a saved file that has been loaded.
2/ Can you see the 'Graph' window? it can get hidden behind the 'M100 ALDL' window. You can click on the top line 'Window' and select 'Tile Vertically' to show all windows.
3/ To see graphs of selected parameters over a period of time, the x-axis parameter window needs setting to 'time'. I notice in your photo it shows coolant temperature, which would give quite an odd looking plot. Try setting them as in photo below and see if you get a result
Your setting:
Try:
If still no luck can you post a picture of your whole ElanScan display to understand how it is setup and what is missing?
1/ Talking and Logging need to be stopped in order to view the graphs from that session or from a saved file that has been loaded.
2/ Can you see the 'Graph' window? it can get hidden behind the 'M100 ALDL' window. You can click on the top line 'Window' and select 'Tile Vertically' to show all windows.
3/ To see graphs of selected parameters over a period of time, the x-axis parameter window needs setting to 'time'. I notice in your photo it shows coolant temperature, which would give quite an odd looking plot. Try setting them as in photo below and see if you get a result
Your setting:
Try:
If still no luck can you post a picture of your whole ElanScan display to understand how it is setup and what is missing?
You do not have the required permissions to view the files attached to this post.
S2 M100 NMY #285
N/A 2010 Evora
N/A 2010 Evora
-

KenS - Enthusiast
- Posts: 242
- Joined: Mon 27.10.2014, 21:04
- Location: North Kent Coast
8 posts
• Page 1 of 1
Who is online
Users browsing this forum: No registered users and 1 guest